Working together
to benefit today’s
students for
future employment.
Regional Overview
As of 2017 the P20 Central Texas Region’s population increased by 11.3% since 2012, growing by 115,168. Population is expected to increase by 8.0% between 2017 and 2022, adding 90,623.
From 2012 to 2017, jobs increased by 11.1% in Central Texas from 388,497 to 431,543. This change outpaced the national growth rate of 7.6% by 3.5%. As the number of jobs increased, the labor force participation rate decreased from 60.2% to 59.5% between 2012 and 2017.
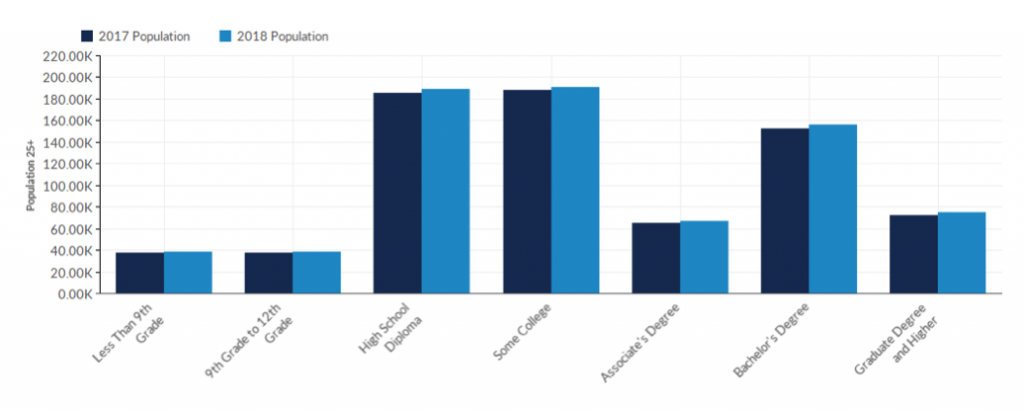
Concerning educational attainment, 20.6% of the selected regions’ residents possess a Bachelor’s Degree (2.2% above the national average), and 8.8% hold an Associate’s Degree (0.9% above the national average)
Educational Attainment by Level
| Education Level | 2017 Population | 2018 Population | 2017 % of Population | 2017 State % Population | 2017 National % Population |
|---|---|---|---|---|---|
| Less Than 9th Grade | 37,809 | 38,578 | 5% | 10% | 6% |
| 9th Grade to 12th Grade | 37,716 | 38,461 | 5% | 9% | 8% |
| High School Diploma | 185,317 | 189,118 | 25% | 25% | 28% |
| Some College | 188,020 | 190,810 | 25% | 22% | 21% |
| Associate Degree | 65,293 | 66,722 | 9% | 7% | 8% |
| Bachelor’s Degree | 151,930 | 155,772 | 21% | 18% | 18% |
| Graduate Degree and Higher | 72,386 | 74,386 | 10% | 9% | 11% |
| 738,470 | 753,847 | 100% | 100% | 100% |

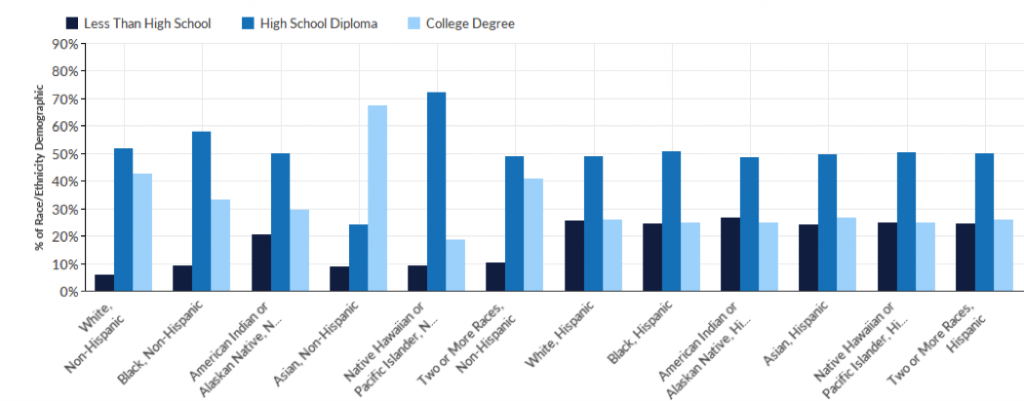
Educational Attainment by Race/Ethnicity

| Race/Ethnicity | 2017 Population | 2018 Population | 2017 Less Than High School | 2017 High School Diploma | 2017 College Degree |
|---|---|---|---|---|---|
| White, Non-Hispanic | 466,907 | 473,479 | 26,807 | 241,409 | 198,692 |
| Black, Non-Hispanic | 76,725 | 78,841 | 6,950 | 44,405 | 25,369 |
| American Indian or Alaskan Native, Non-Hispanic | 3,226 | 3,311 | 659 | 1,610 | 958 |
| Asian, Non-Hispanic | 33,258 | 34,911 | 2,864 | 8,015 | 22,380 |
| Native Hawaiian or Pacific Islander, Non-Hispanic | 2,211 | 2,272 | 205 | 1,596 | 410 |
| Two or More Races, Non-Hispanic | 10,476 | 10,863 | 1,068 | 5,119 | 4,289 |
| White, Hispanic | 131,588 | 135,653 | 33,457 | 64,165 | 33,966 |
| Black, Hispanic | 5,700 | 5,856 | 1,387 | 2,891 | 1,422 |
| American Indian or Alaskan Native, Hispanic | 3,828 | 3,939 | 1,022 | 1,861 | 945 |
| Asian, Hispanic | 1,220 | 1,272 | 292 | 603 | 325 |
| Native Hawaiian or Pacific Islander, Hispanic | 509 | 521 | 127 | 256 | 126 |
| Two or More Races, Hispanic | 2,824 | 2,929 | 687 | 1,409 | 727 |
| 738,470 | 753,847 | 75,525 | 373,337 | 289,608 |
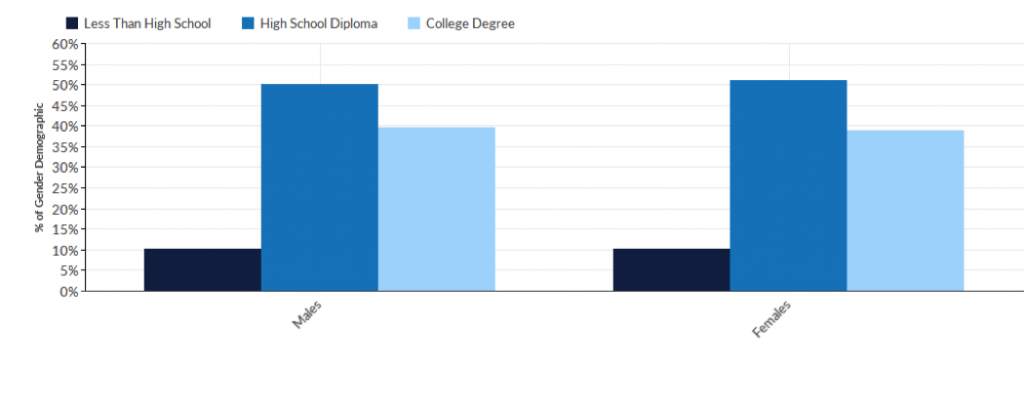
Educational Attainment by Gender

| Gender | 2017 Population | 2018 Population | 2017 Less Than High School | 2017 High School Diploma | 2017 College Degree |
|---|---|---|---|---|---|
| Males | 356,300 | 363,675 | 36,627 | 178,604 | 141,070 |
| Females | 382,170 | 390,171 | 38,898 | 194,733 | 148,539 |
| 738,470 | 753,847 | 75,525 | 373,337 | 289,608 |
Program Table
The program table correlates the top 25 educational programs in the region with the number of completions, the median hourly wage in those related fields and how many of the occupations are in the region.
| CIP Code | Program | Institutional Completions (2016) | Median Hourly Earnings | Regional Jobs (2016) |
|---|---|---|---|---|
| 43.0104 | Criminal Justice/Safety Studies | 386 | $34.42 | 91 |
| 51.3801 | Registered Nursing/Registered Nurse | 314 | $29.72 | 7,919 |
| 52.0201 | Business Administration and Management, General | 307 | $33.20 | 12,767 |
| 24.0101 | Liberal Arts and Sciences/Liberal Studies | 209 | $27.86 | 1,670 |
| 52.0101 | Business/Commerce, General | 196 | $35.21 | 11,802 |
| 11.0401 | Information Science/Studies | 190 | $47.63 | 2,816 |
| 11.0201 | Computer Programming/Programmer, General | 130 | $35.98 | 7,209 |
| 52.0905 | Restaurant/Food Services Management | 111 | $18.11 | 529 |
| 44.0401 | Public Administration | 101 | $35.94 | 7,706 |
| 51.3901 | Licensed Practical/Vocational Nurse Training | 87 | $21.36 | 2,376 |
| 11.0101 | Computer and Information Sciences, General | 69 | $39.57 | 4,755 |
| 42.0101 | Psychology, General | 67 | $31.76 | 429 |
| 47.0604 | Automobile/Automotive Mechanics Technology/Technician | 62 | $17.02 | 2,278 |
| 48.0508 | Welding Technology/Welder | 60 | $17.76 | 976 |
| 51.0904 | Emergency Medical Technology/Technician (EMT Paramedic) | 59 | $16.02 | 662 |
| 43.0103 | Criminal Justice/Law Enforcement Administration | 56 | $34.42 | 91 |
| 52.0301 | Accounting | 56 | $27.35 | 4,086 |
| 44.0701 | Social Work | 51 | $21.63 | 1,086 |
| 47.0201 | Heating, Air Conditioning, Ventilation and Refrigeration Maintenance Technology/Technician | 47 | $17.09 | 1,210 |
| 52.0401 | Administrative Assistant and Secretarial Science, General | 45 | $15.99 | 8,538 |
| 45.0101 | Social Sciences, General | 41 | $34.01 | 80 |
| 19.0709 | Child Care Provider/Assistant | 40 | $8.66 | 4,019 |
| 31.0505 | Kinesiology and Exercise Science | 39 | $27.94 | 95 |
| 51.1508 | Mental Health Counseling/Counselor | 38 | $20.98 | 239 |
| 26.0101 | Biology/Biological Sciences, General | 37 | $39.22 | 157 |

